1 min read
How to Set up Electronic Funds Transfer (EFT) in Sage X3
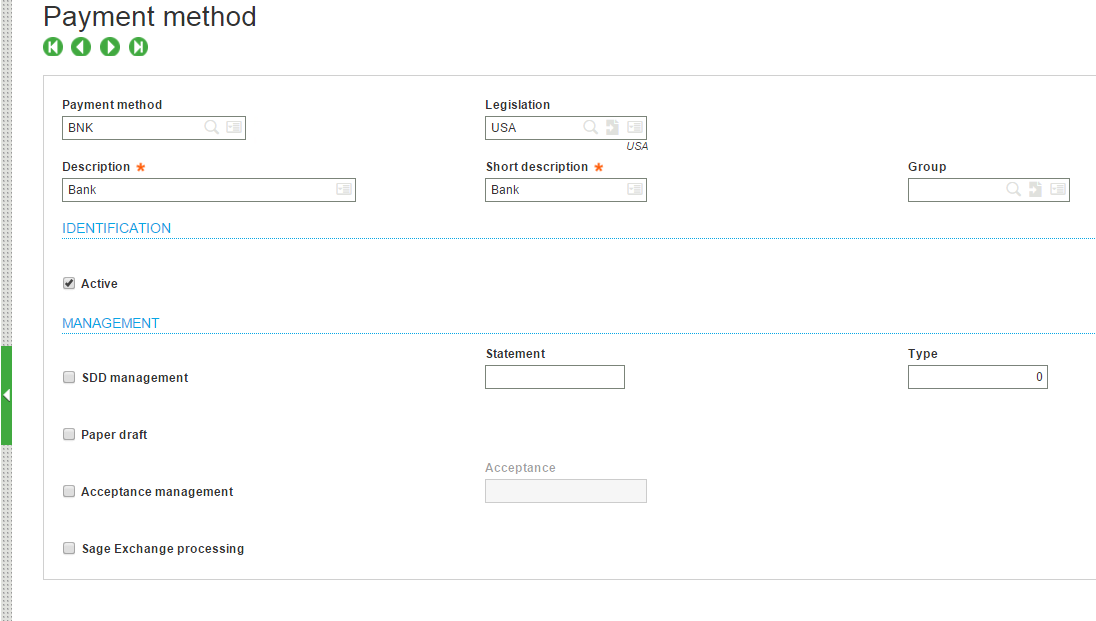
8 Steps to Set Up Electronic Funds Transfer (EFT) in Sage X3 More and more businesses are transacting money through Electronic Funds Transfer (EFT)...
4 min read
Cliff Hall at Cortekx Fri, Mar 04, 2016

 5 Steps to Getting Started with Cloud Business Intelligence
Cloud business applications have become major topics of conversation in the information technology world, such as Cloud ERP, CRM and Business Intelligence. The reason for all the hype is because moving to the cloud is a great way to optimize your business and positively impact your bottom line. This article discusses the simplicity, accessibility and value around Cloud Business Intelligence.
In a nutshell, Cloud Business Intelligence (BI) allows your company to analyze your cloud ERP and other raw data in a way that makes it useful and meaningful for business decision making. It transforms your cloud ERP and other data into small packets, called Data Marts that give you the ability to define and view the data the way you need it. This allows you to interpret the data, make decisions, respond and take action on the best course to take next. Lucky for us, Microsoft has been delivering BI to their small to mid-size customers since late 2011 and early 2012. Did you know that the most predominant tool used for BI is the in depth development of Excel and the Excel “Power Tools” consisting of Excel’s Power Pivot, Power Query, Power View and Power Map and most powerfully in the Office365 cloud offering. To add to that suite, last year Microsoft released their new PowerBI product. Built with Excel functionality inside, provides ease of use and connectivity to all the office 365 products, as well as, numerous cloud offerings. To that point, there are direct links from PowerBI to what they call content packs, such as Google Analytics, Mail Chimp, Marketo just to name a few, as well as Cloud ERP platforms such as Acumatica. This makes it is possible to access raw data from a multiple sources, define and combine data to present it for decision making.
Here is one scenario: Let’s say you run a retail wine business and your goal is to find out what economy influences drive your sales volume, pricing and create expected future forecast. This is exactly what PowerBI was built for! With the ability to access information from a variety of data sources, you can run an analysis of your sales and pricing data for the last 24 months to determine if there’s any correlation. In our example we’re going to say we did this and found that gasoline prices directly affect your sales volume and the prices you can charge for your products. So, now what do you do? You can use the data with PowerBI and or the Excel Power Tools to create both historical trends and graphics as well as predictive graphics and KPIs (key performance indicators) to help keep your finger on the pulse of your business and make decisions based on what the system is forecasting and recommending you do.
Cliff Hall,
President, CEO
Cortekx HGL, Inc.
Another version of this blog was previously posted on February 22, 2016. 5 Steps To Business Intelligence In The Cloud, Made Easy!
Photo courtesy of freedigitalphotos.net by Pakorn

1 min read
8 Steps to Set Up Electronic Funds Transfer (EFT) in Sage X3 More and more businesses are transacting money through Electronic Funds Transfer (EFT)...

3 Ways Inventory Control Software Helps Balance Stock-In and Stock-Out According to best practices of inventory control, there is a challenging...

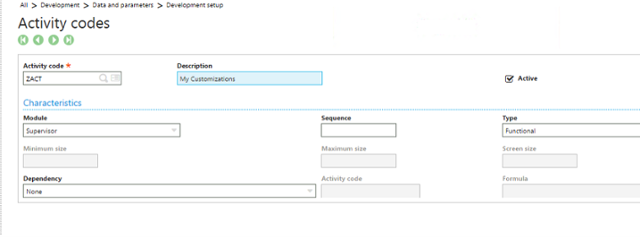
Sage ERP Consultant: 4 Steps to Make Customizations Patches in Sage X3 Throughout the year, Sage releases an occasional patch for Sage X3 in order to...