3 min read

ERP Software: Best Practices for Financial Dashboards - Part I

ERP Software: Best Practices for Financial Dashboards - Part I

Managing the ERP Software Financial Dashboard Operating Environment  

Maintaining the attention of company stakeholders is key to the success of business intelligence tools like financial dashboards. In our experience, business owners will quickly drop interest in logging into yet another system unless the operating environment supporting their dashboard view is stable, self-automating, and serves-up relevant data. To help retain attention, today we’re outlining best practices for managing the operating environment, with subsequent topics specific to the focus and formatting of the dashboard. Getting actionable information from financial dashboards can be realized with some forward planning, and will enhance high-level support of the company’s Enterprise Resource Planning (ERP) efforts. 


While some of our recommendations can be applied to different systems –limitations apply. For getting around these, underlying features matter, and so we recommend Intacct. True web-access, custom reporting and metrics, real-time consolidation of multi-entity and currency, automation of complex billing rules, and a wide-array of data dimensions, to name a few, give Intacct users the power to ultimately script good dashboards. Having established this, let’s move on to some specific suggestions for configuring the system to ensure the key audience is hooked.
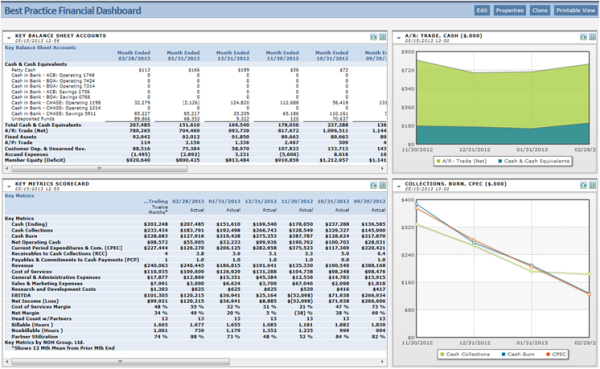
Financial Dashboards

  • Single System – Encourage accessing dashboards that are packaged with the ERP system. While complex data analysis and multiple data marts can compel companies to sponsor dashboard reporting separate from their underlying ERP, failed and slow synchronizations, multiple logins, and other glitches to access will quickly discourage further interest. Trade-offs are acknowledged with this strategy (see below for workarounds), though a single system approach outweighs the setbacks of failed access and slow updates.
  • Access & Landing – Ensure there’s immediate dashboard presentation from the point of login. Set and test Exec.’s upfront permissions for general system, dashboard, and drill down access. Default the initial navigation to the summary financial dashboard by configuring the “my start page” in user preferences. Finally, get screen settings appropriate in user preferences so the full-width of the dashboard can be viewed. This will ensure there’s no confusion over access and/or navigation, and all components of the dashboard are easily visible.
  • Unified Reporting – Bring together results from multiple entities or segments into a single reporting currency, and combine non-currency operating statistics and metrics. From here, your dashboard provides a unified view of the company’s financial position –and increased visibility. While getting some operating statistics may entail separate statistical journalization or using web services integration, we believe it’s well worth the manual and/or development effort. Stick with what you can automate and leave-off of the multiple systems and reporting layers approach.
  • Self-Winding – Configure the dashboard and its related components –reports, metrics, and graphs— to present live and current period data. For Intacct users, this means configuring “live” rather than “snapshot” status for reports and metrics (graphs are by default set to a live status), to avoid “refresh” confusion. Because Intacct limits live report components to four per dashboard (again, this excludes graphs) plan to limit your report presentation to this number, and create additional dashboards if necessary. In writing rolling period reports and snapshots ensure they use system capabilities to automatically update the current and trailing periods so the most recent period is clearly visible on the left side of the report, with trailing or comparative periods to the right. This “self-winding” or auto refresh approach will ensure users do nothing to get the most recent and refreshed set of system data available.
  • Number Crunching – Make full use of the system’s underlying capabilities to perform calculations and serve them up. Dashboard components such as metrics reports that feature ratios, cash burn and collection, margin, and other system calculated values are valuable information to business owners searching for operating statistics. By utilizing such features as Computational Account Groups to perform instant analysis on live data you bring value to metrics reports on the dashboard, keep focus, and reduce the need to “export to Excel.”


We’ve reviewed the importance of attracting stakeholder interest in dashboards and outlined strategies for system use and configuration to retain interest. By managing a single, easy to access, live, and comprehensive reporting tool, and acknowledging some tradeoffs, we think Exec.’s get a better view of the trends and risks of their business. Next edition we’ll cover strategies for focus, including the selection of dashboard components for maximum impact and decision support.

Contact us if you need help with financial dashboard reporting or any additional finance, accounting, tax, or accounting technology services.  Visit us at www.ndhcpa.com.

ERP Software Implementation: 5 Steps to Mapping Out Your Project

1 min read

ERP Software Implementation: 5 Steps to Mapping Out Your Project

Break it down: come up with a detailed model of your operations and processes. Every business is different; know what yours is all about before you...

Read More
Why Cloud Accounting Software?

Why Cloud Accounting Software?

Considering How "Cloud Accounting" Fits For Your Business According to Gartner Research, spending on “cloud” or browser-based applications will...

Read More